Matt Keeter's project page for Antimony, a node-based CAD tool built on a dataflow graph engine, a CSG geometry engine, and a Python-scripted standard library of shapes, covering its foundations, scripting model, rendering, and the history of its releases.
about
Antimony is a computer-aided design (CAD) tool from a parallel universe
in which CAD software evolved from Lisp machines rather than drafting tables.
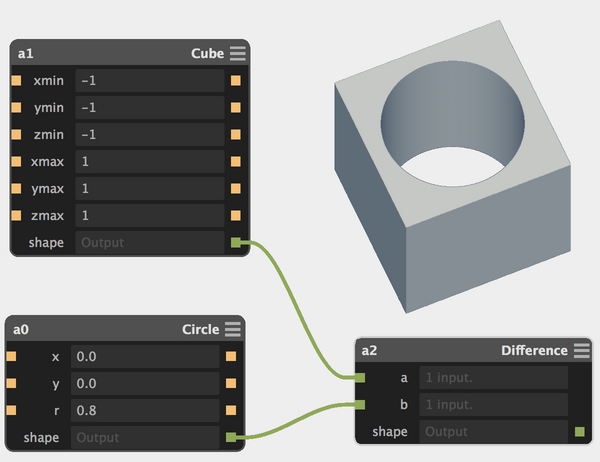
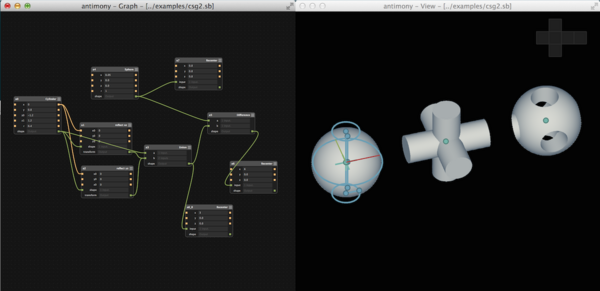
Solid modeling in Antimony is done by connecting nodes in a graph:
Each node is defined by a customizable script.
Antimony uses Python 3.x plus a few extra magic keywords.
Here's what the circle node above looks like:
import fab.shapes

# Define a set of input ports
# (and inject variables into the local namespace)
input('x', float)
input('y', float)
input('r', float)

# Call the 'circle' function in the standard shapes library
# using the variables that came in from the input ports
c = fab.shapes.circle(x, y, r)

# Create an output port that produces the circle shape
output('shape', c)
Nodes usually represent a primitive shape or transform.
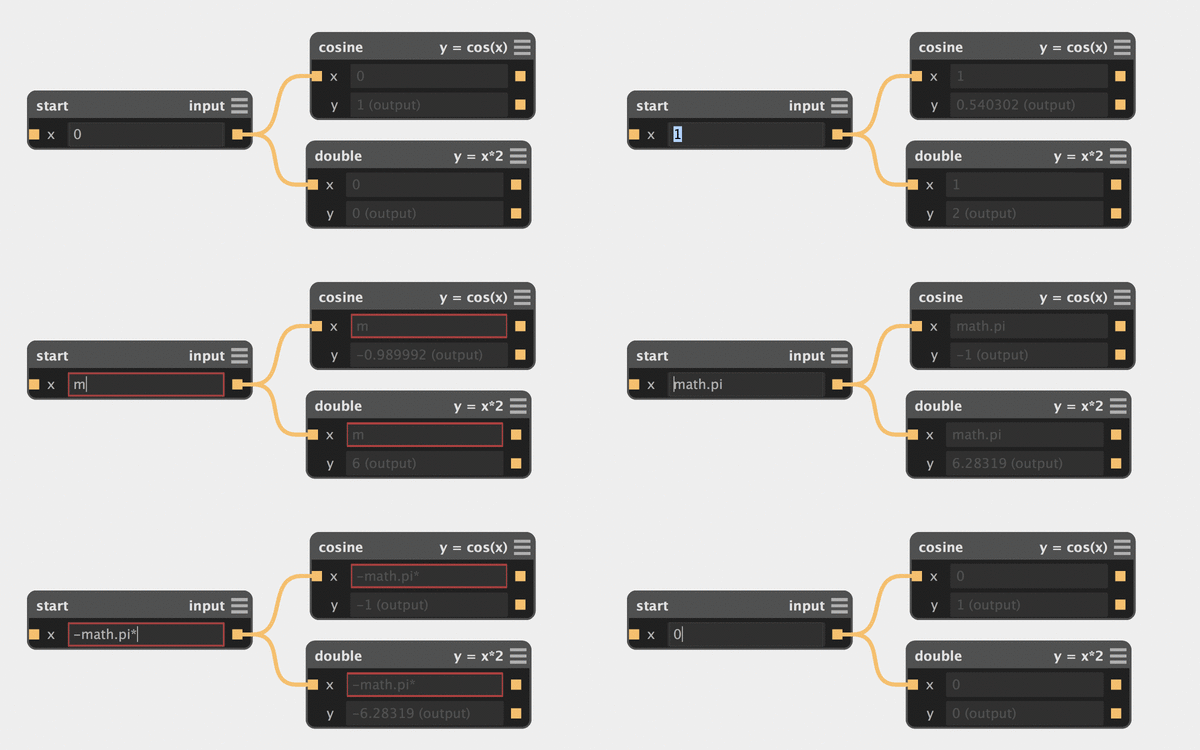
Links are tracked and changes are automatically propagated downstream.
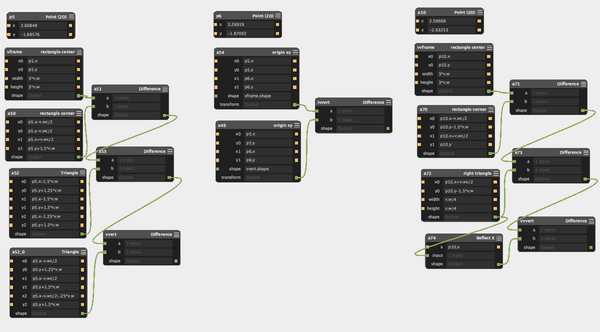
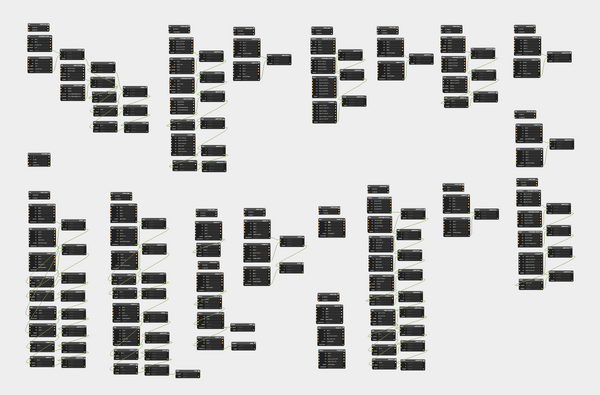
The graph engine scales up to complex multi-part assembles.
Geometry engine
Antimony's geometry engine uses
functional representations
for solid modeling.
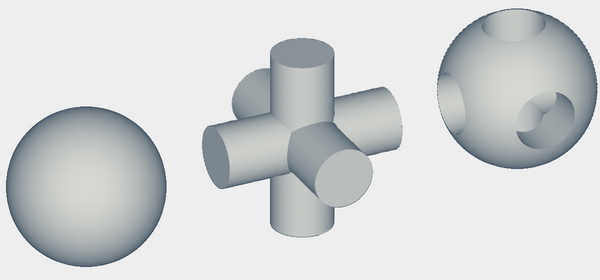
This representation is particularly suitable for modeling with boolean operations
(union / intersection / difference).
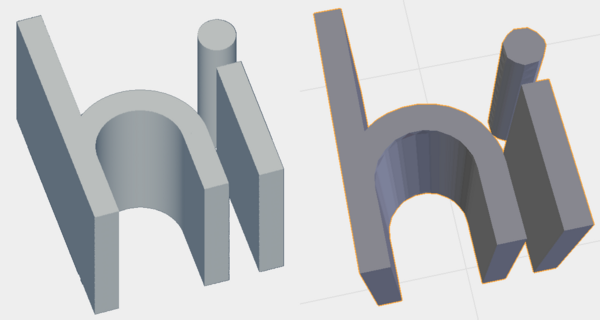
In the application, the geometry engine renders shapes as shaded bitmaps.
They're then blitted to a 3D viewport.
Antimony can export heightmaps for 2.5D processes and .stl files
for 3D manufacturing. The .stl export includes feature detection
to keep corners and edges sharp.
Standard library
Antimony's standard library defines many shapes and transforms,
from basic (rotate, scale, boolean operations) to unusual
(attract, repel, bend).
These shapes are used in node definitions, which typically add input
and output ports and can optionally define UI features.
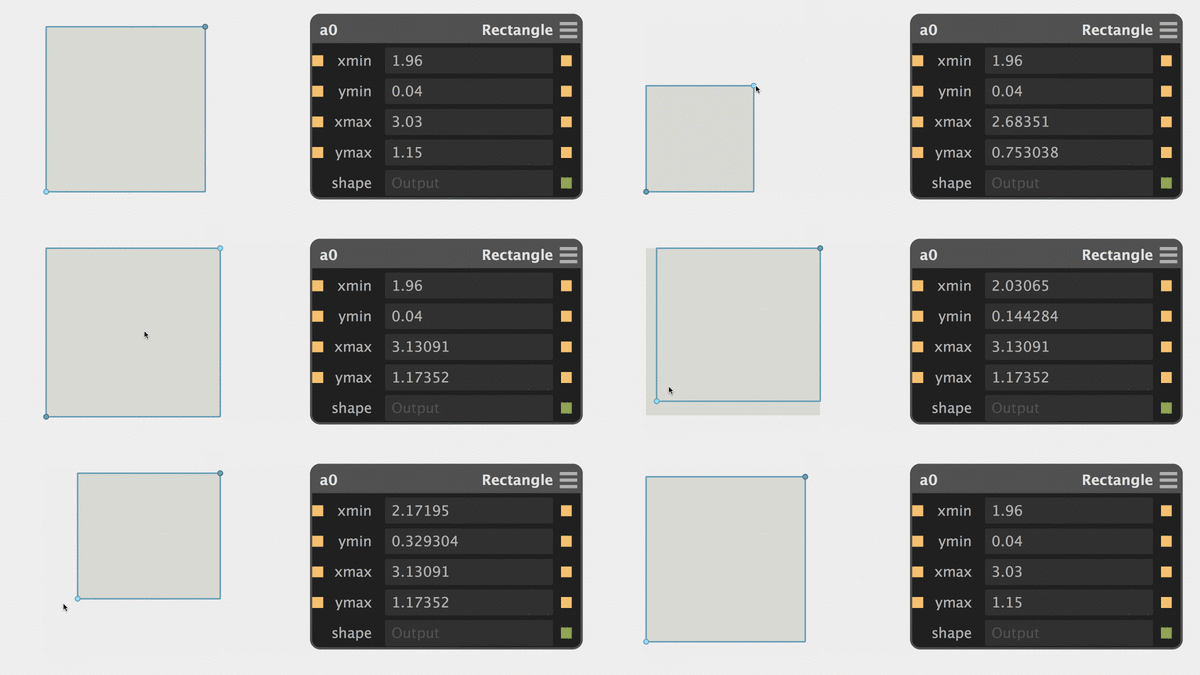
Here's an example of a node that defines UI features:
In the 3D viewport, the UI features defined at the bottom of the script
are drawn over the rendering of the rectangle.
These UI features are hooked back into the graph: dragging
the points at the rectangle's corners pushes changes to the
graph node.
As an aside: most users will be satisfied with the built-in shapes,
but it's also possible to define custom shapes.
Shapes are represented with a prefix string syntax that's easy to
parse but a bit cryptic to decipher. Here's the definition for the
circle shape used above:
It's at a beta level of stability: solid, but not recommended for mission-critical use.
If you're interested in contributing, there's a pretty low bar for entry.
Given basic Python knowledge, you can get started making
custom nodes (like this HSB color node
contributed by RobotGrrl or the
plethora of nodes contributed by
Neil).
For more ambitious folks with C++ experience, there are a whole host of
improvements that could be made, from speeding up rendering to cleaning
up the UI and optimizing graph evaluation. Send me a note if this
piques your interest.