The Shadows Lurking in the Equations
 If you've ever graphed equations, chances are you have only ever graphed equations in what I refer to as "Binary mode" - which draws a line where the equation is EXACTLY equal, and leaves white everywhere else.
FuzzyGraph, on the other hand, visualizes equations in a Fuzzy/Non-Binary mode - showing not only where an equation are exactly equal, but also where the equation nearly equal and where the equation is far from equal (where the error is high). And when we look at things in this Non-Binary way, we can suddenly see the previously invisible mathematical shadows have been lurking in the equations .
Let's look at some examples...
Example 1: Slash Dot Equation
Here is the "Slash Dot" Equation ( \( \frac{y}{x^2+y^2} = \frac{x+1}{x^2+y^2} \)) as both a conventional and fuzzy graph...
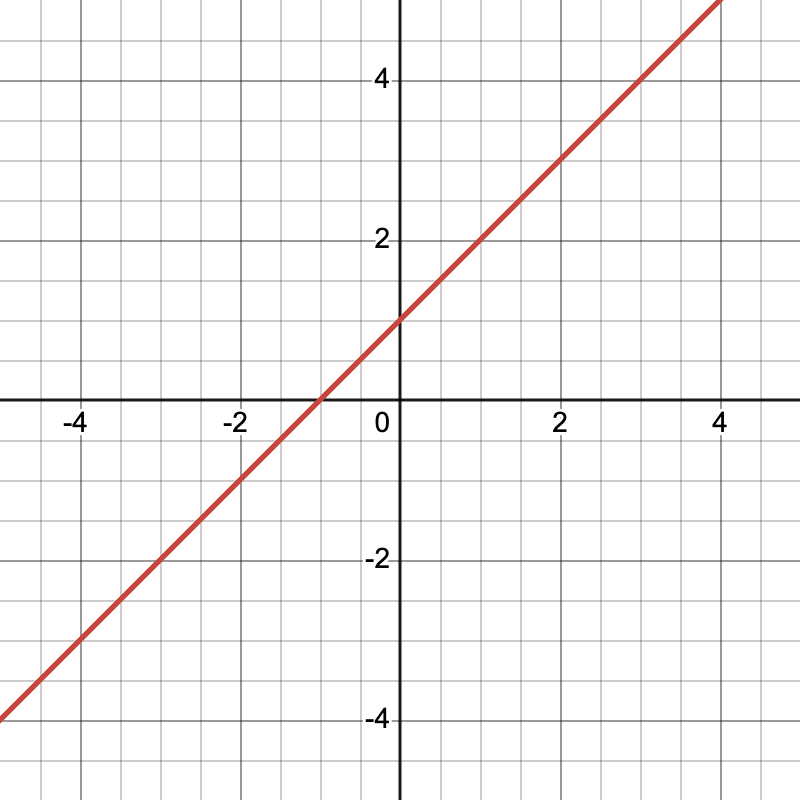 Conventional graph of \( \frac{y}{x^2+y^2} = \frac{x+1}{x^2+y^2} \)
 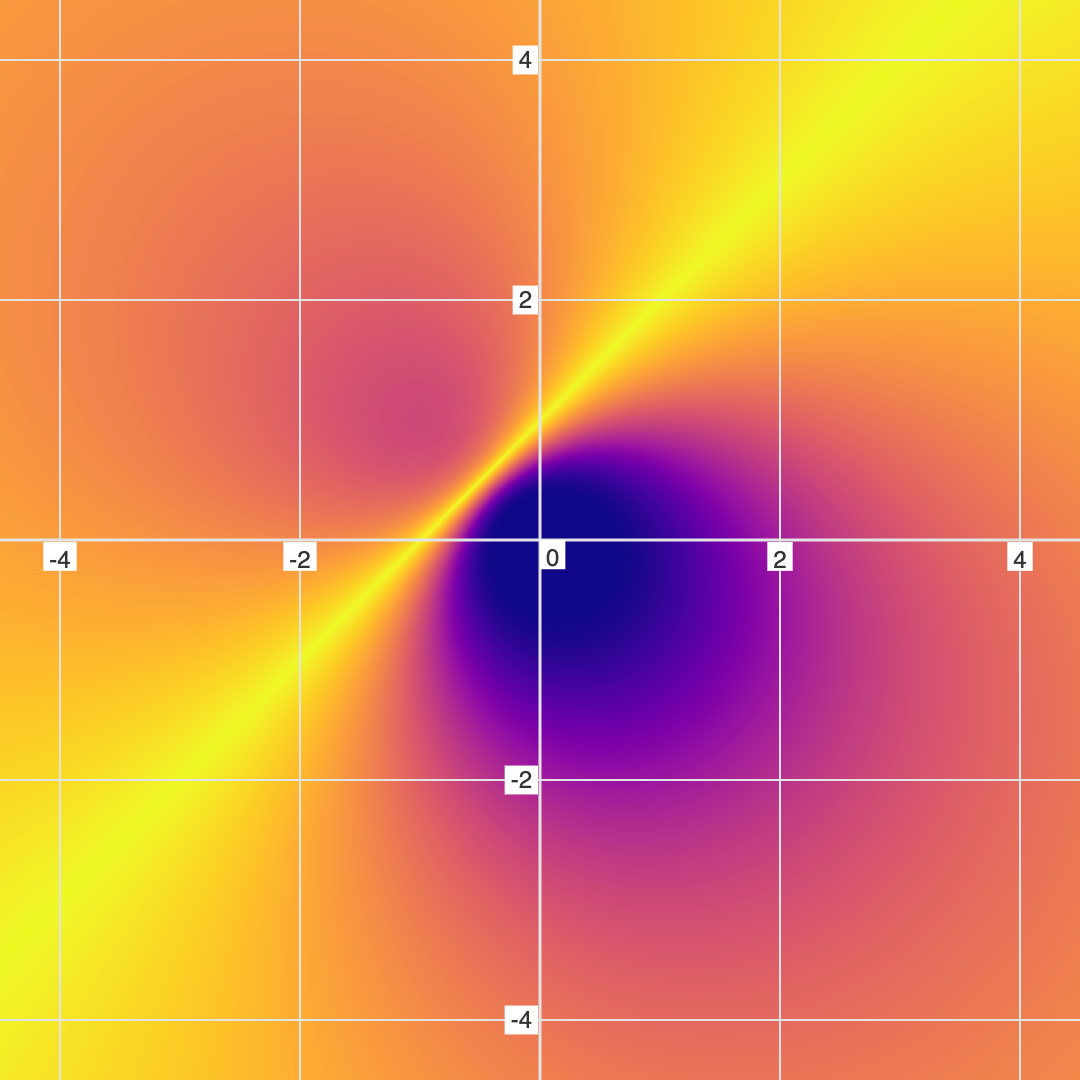 Fuzzy graph of \( \frac{y}{x^2+y^2} = \frac{x+1}{x^2+y^2} \)
Note the giant black hole that is present in the Fuzzy/Non-Binary graph, but invisible in conventional/Binary graphing. This "black hole" feature represents a region of high error in the equation.
Example 2: Quasar Equation
Let's look at another example: \(y = \frac{x}{x^2 + y^2} \)
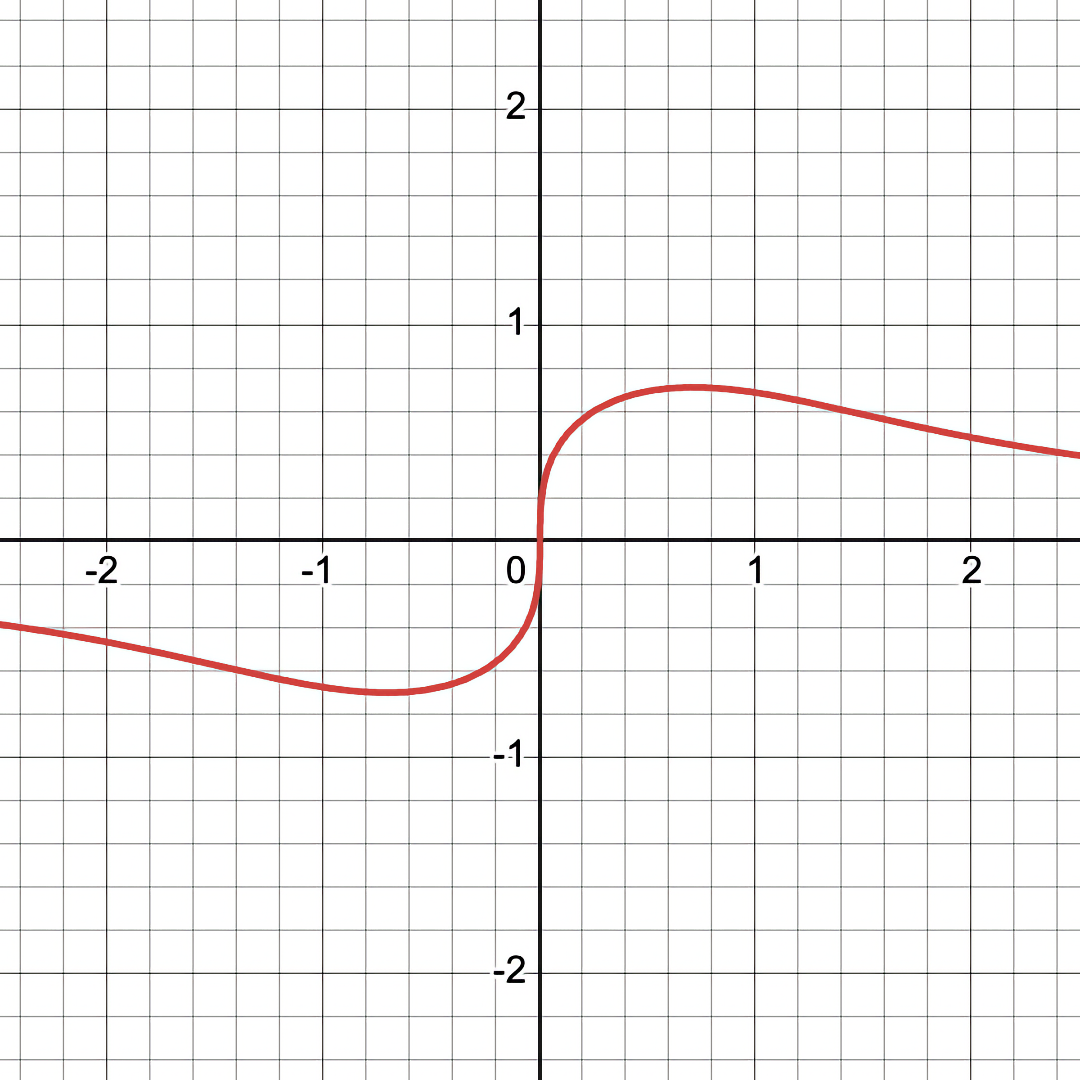 Conventional graph of \(y = \frac{x}{x^2 + y^2} \)
 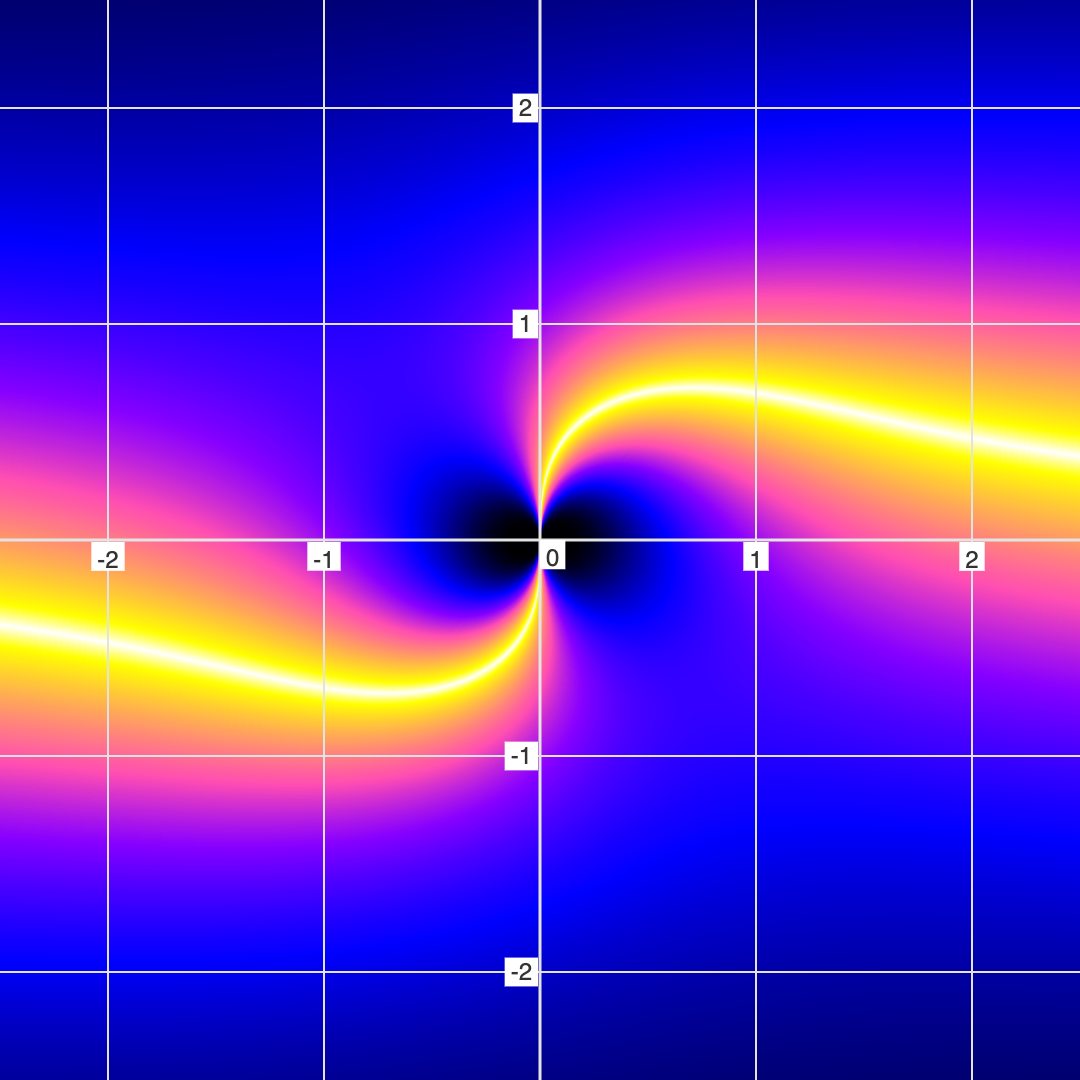 Fuzzy graph of \(y = \frac{x}{x^2 + y^2} \)
Notice that the black hole eye-looking features are COMPLETELY INVISIBLE in the conventional/binary mode of graphing.
Example 3: Simple Star and Black Hole
To get a better idea of what these black hole things are, let's look at a simpler example. First let's look at the opposite of a black hole - a simple star/particle example: \( x^2 + y^2 = 0 \). For this equation, there is only 1 solution: (0, 0). So if you graph this in a conventional graphing app, it will only show a single dot at (0, 0). But in FuzzyGraph, it looks like a fuzzy particle or something.
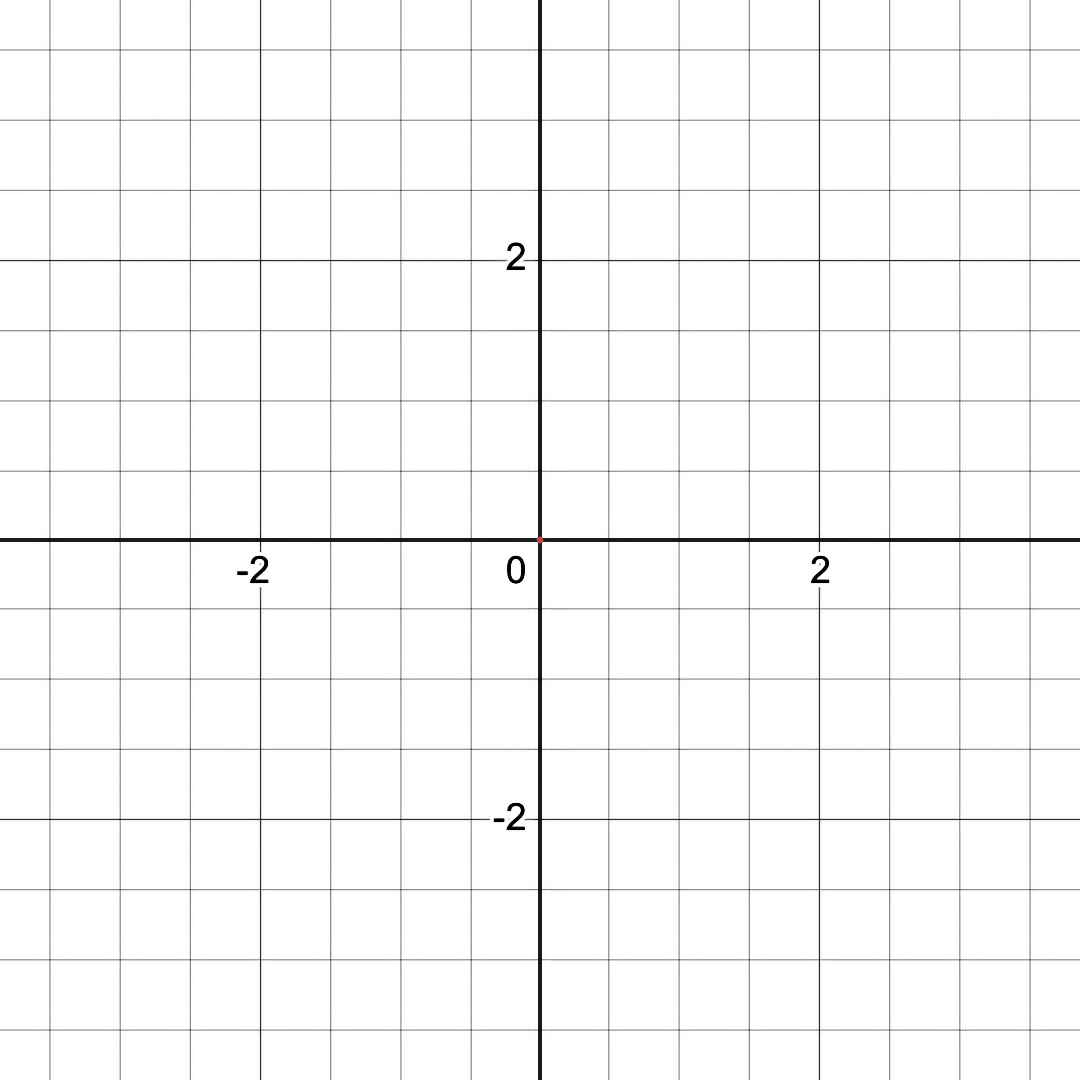 Conventional graph of \( x^2 + y^2 = 0 \)
 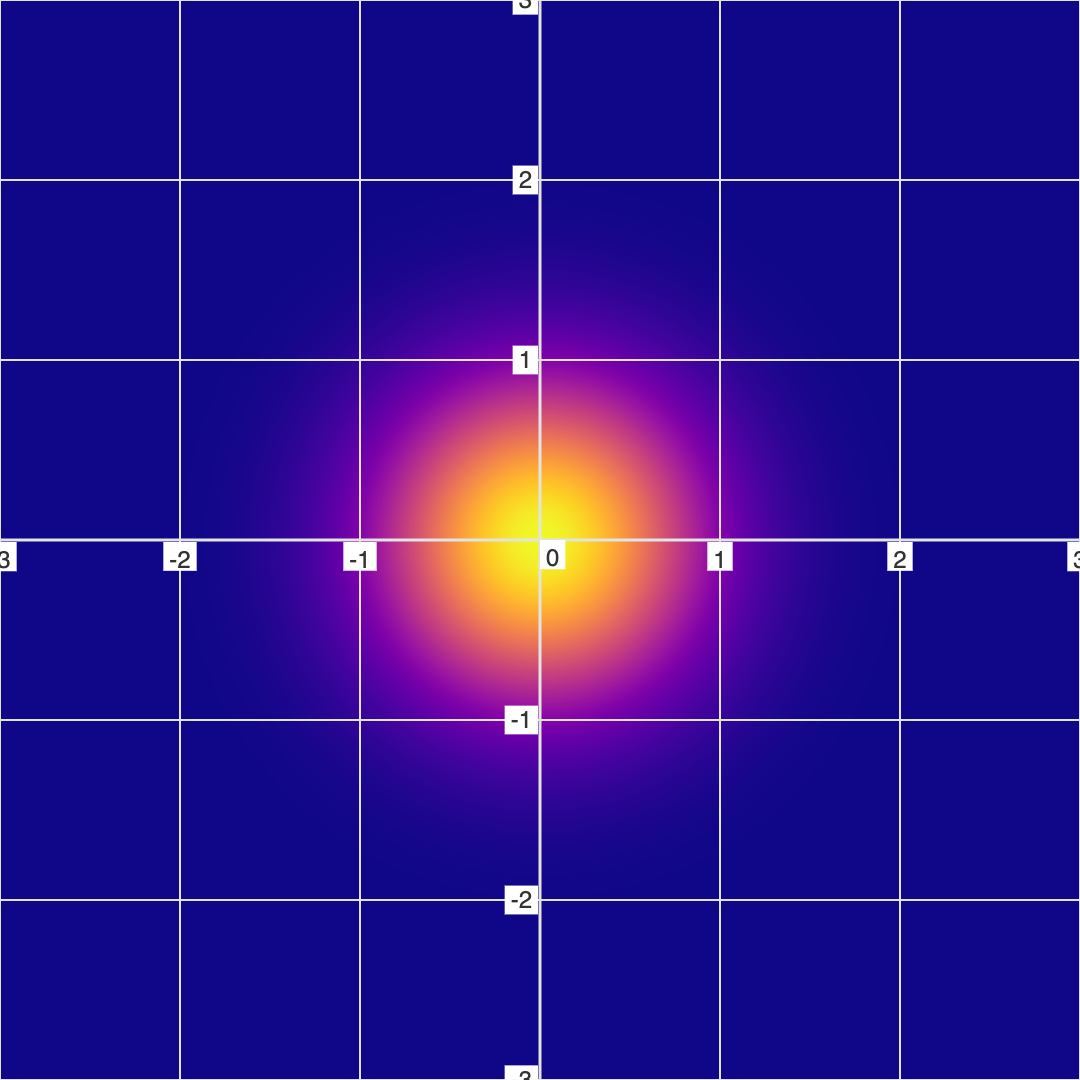 Fuzzy graph of \( x^2 + y^2 = 0 \)
But now, let's invert this to get the "Black Hole Equation": \( \frac{1}{x^2+y^2} = 0 \)...
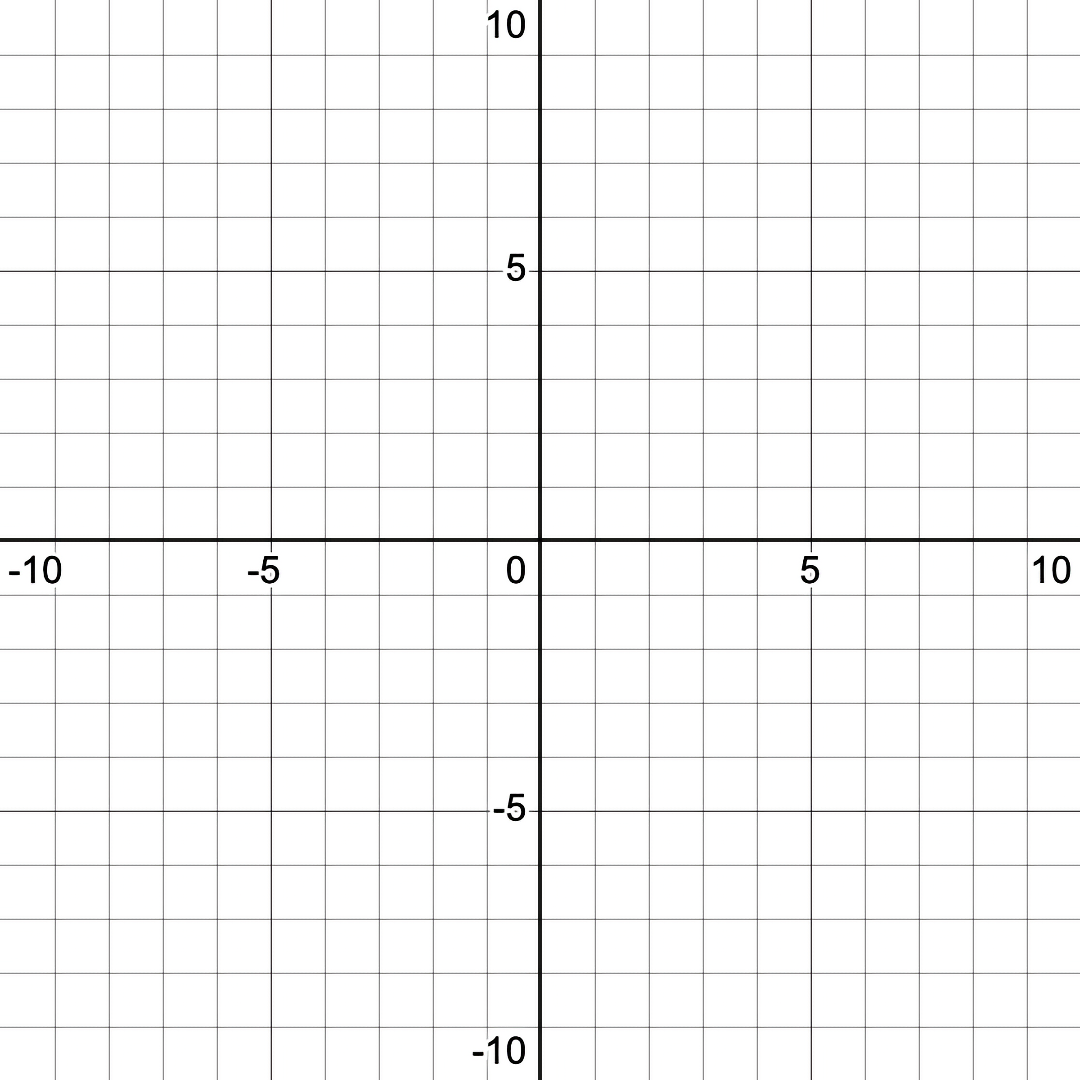 Conventional graph of \( \frac{1}{x^2 + y^2} = 0 \)
 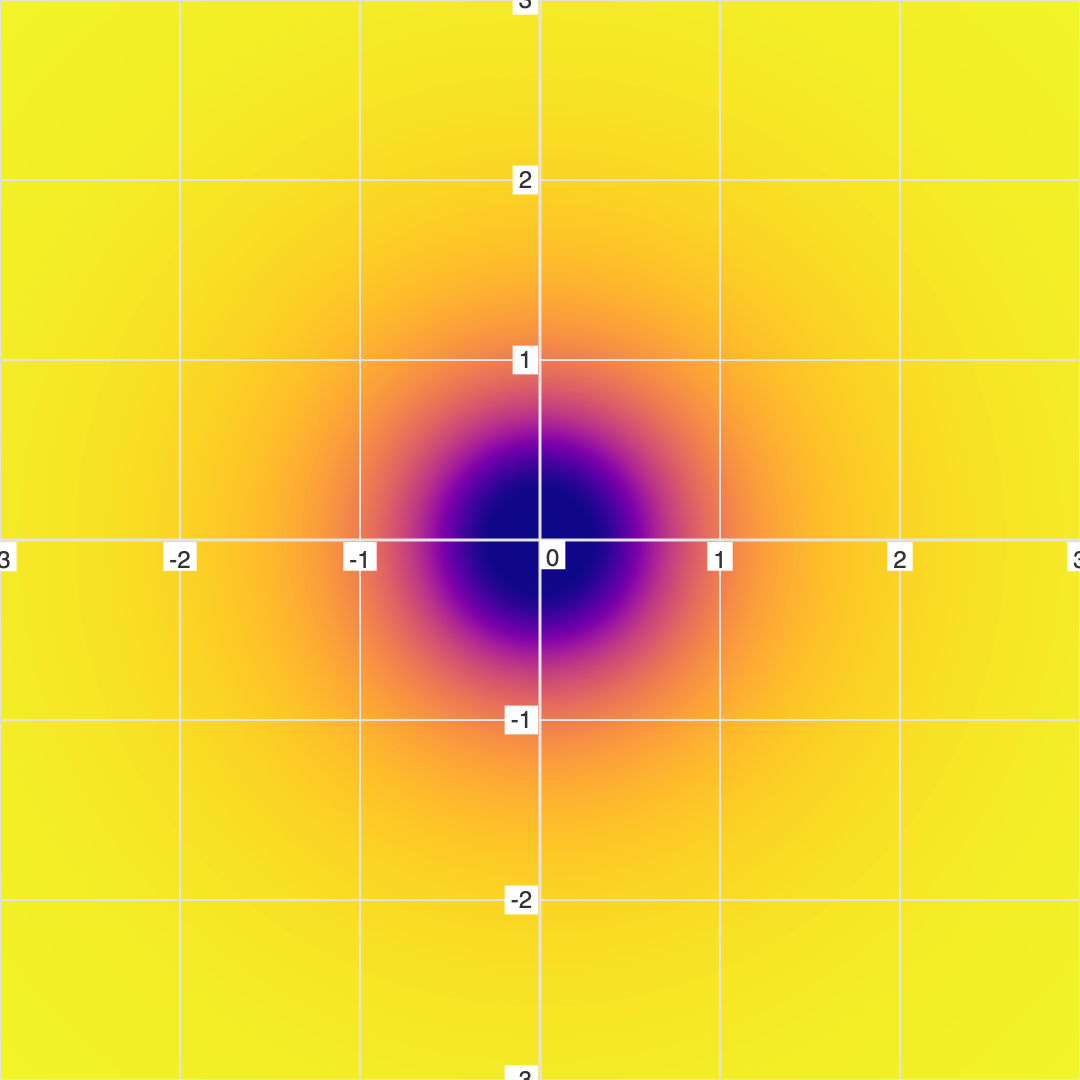 Fuzzy graph of \( \frac{1}{x^2 + y^2} = 0 \)
In this case, there is absolutely nothing to show on a conventional graph, as there are actual solutions to this equations. However, there is still a mathematical topography which can be visualized (as can be seen in the fuzzy graph).
Example 4: Shadow Line
Not all of the Shadows are like black holes.
In this example, let's start by combining 2 lines together: \(y=x\) and \(y=-x\).
We can visually add 2 equations together by refactoring them so they are both equal to 0, and then multiplying the two refactored equations together. \(y=x\) can be changed to \(y-x=0\), and \(y=-x\) can be refactored to \(y+x=0\).
We can then combine 2 into a single equation these like this: \( (y-x) \times (y+x) = 0 \)
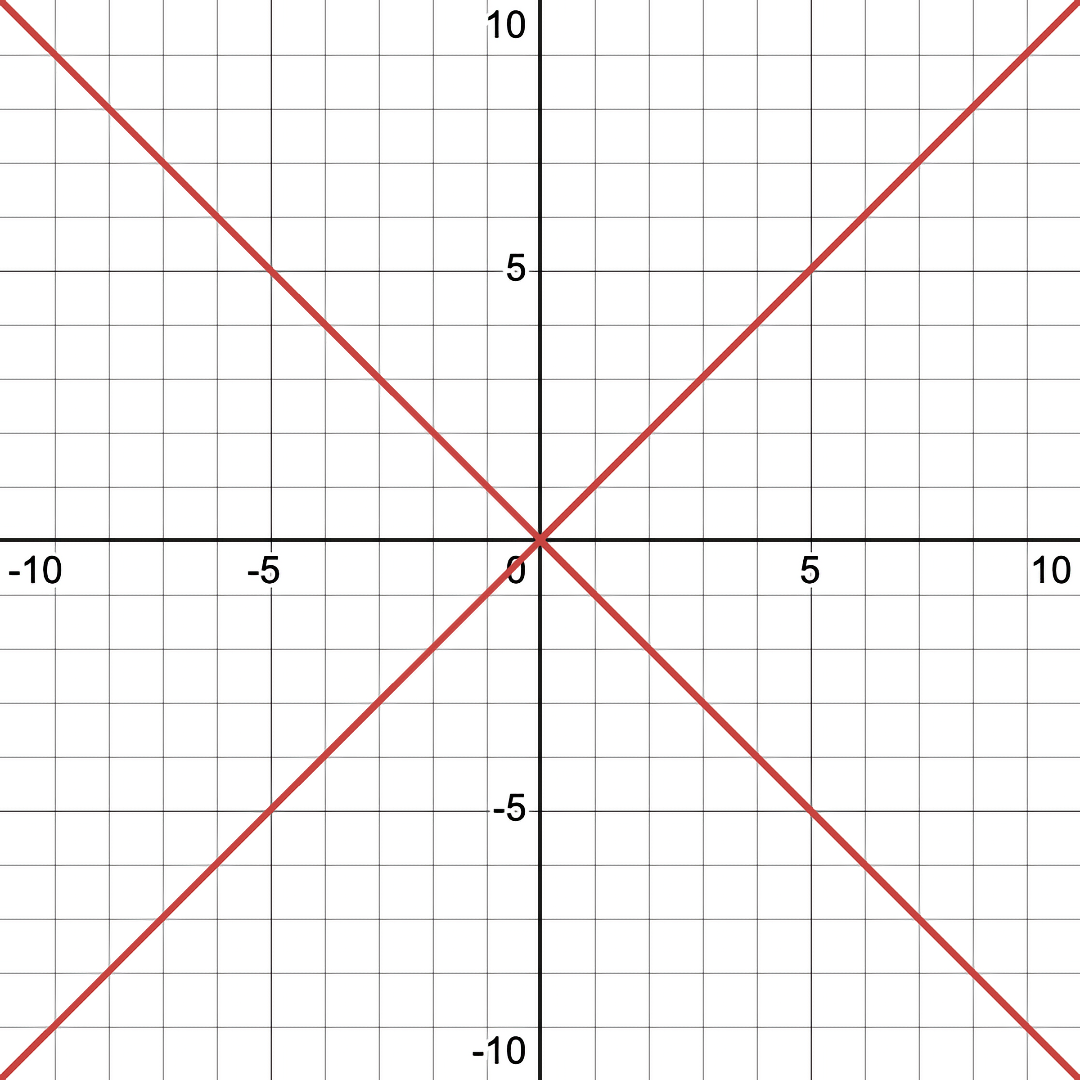 Graph of \( (y-x) \times (y+x) = 0 \)
 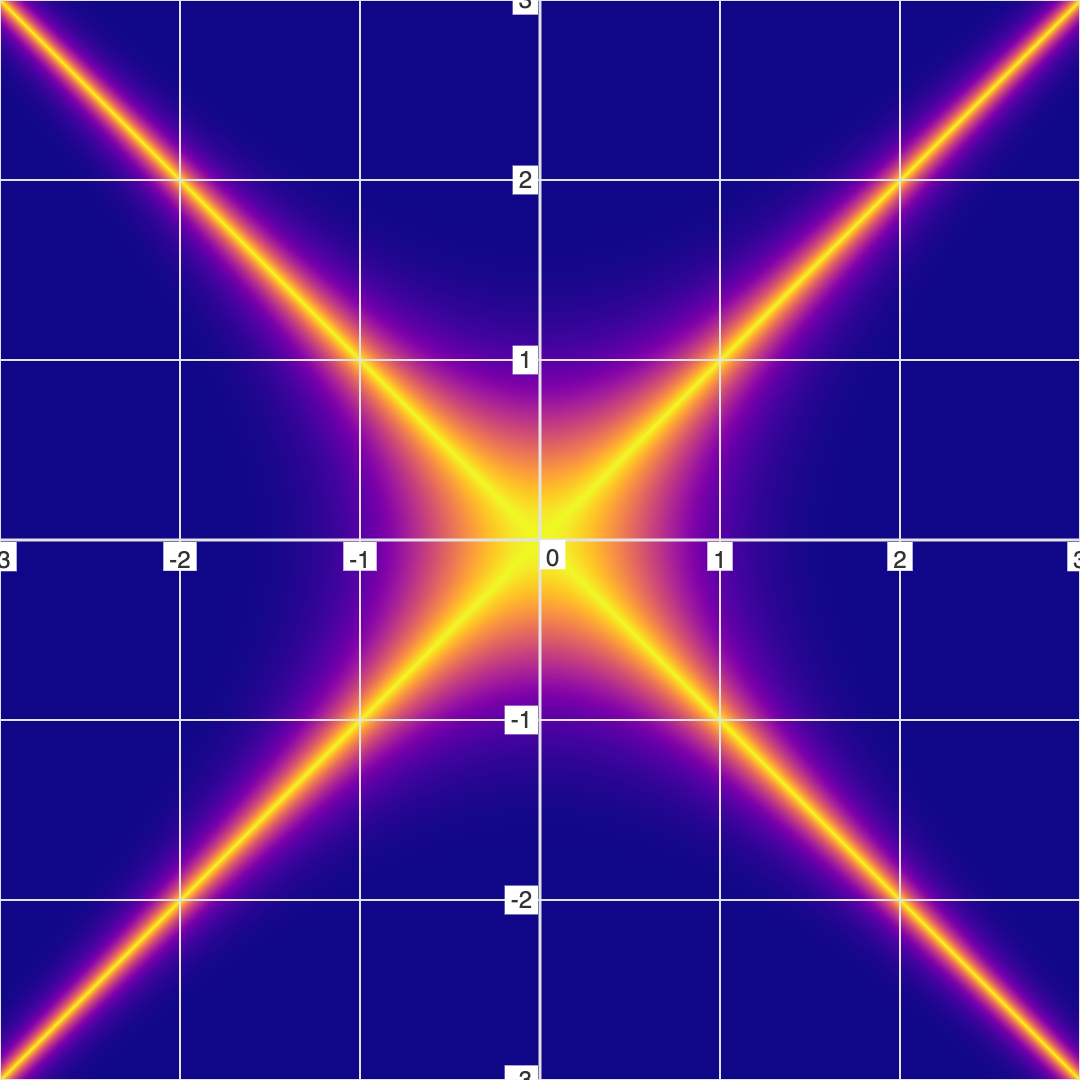 Fuzzy graph of \( (y-x) \times (y+x) = 0 \)
And now, let's invert one of the equations using division: \( \frac{x-y}{x+y} = 0 \)
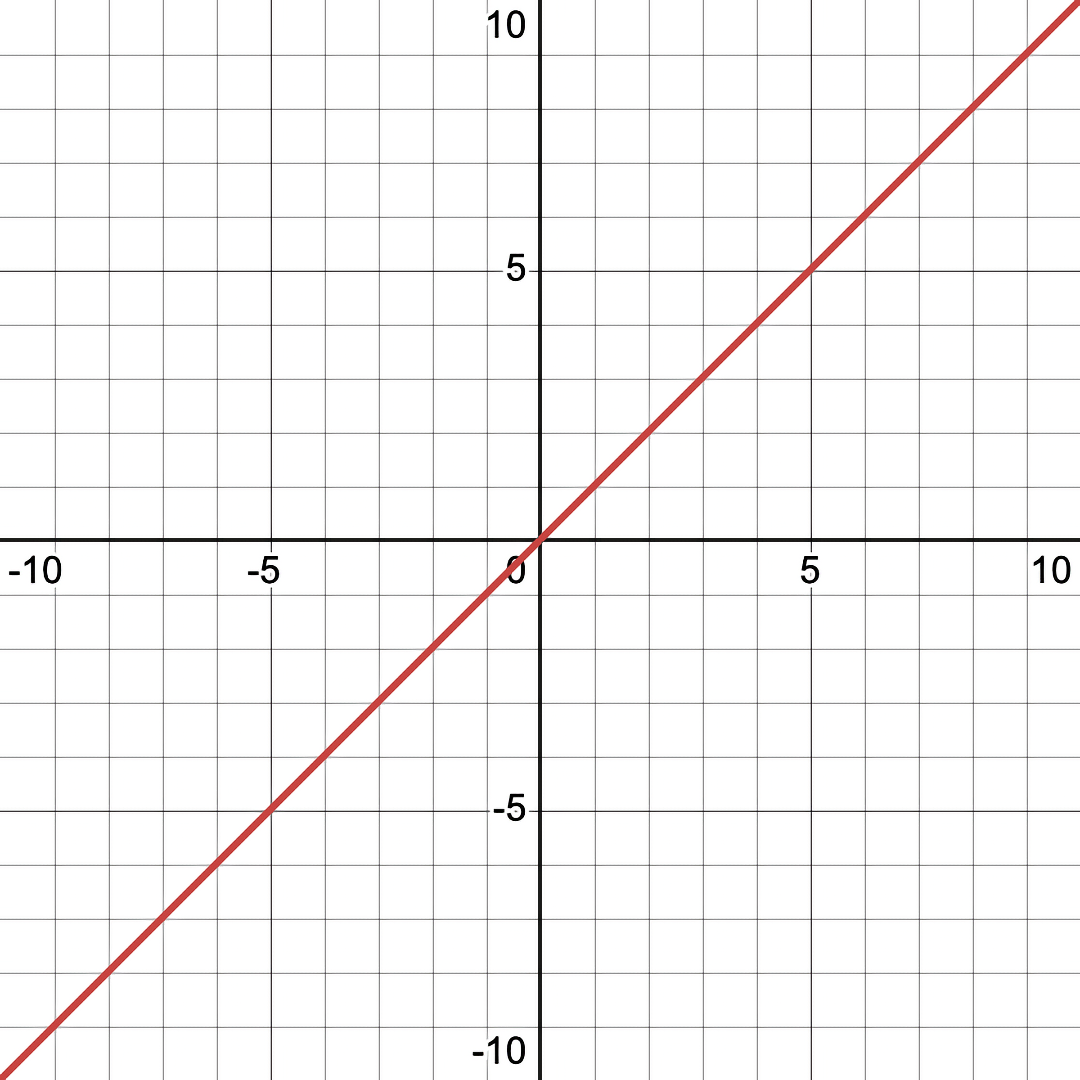 Graph of \( (y-x) \times (y+x) = 0 \)
 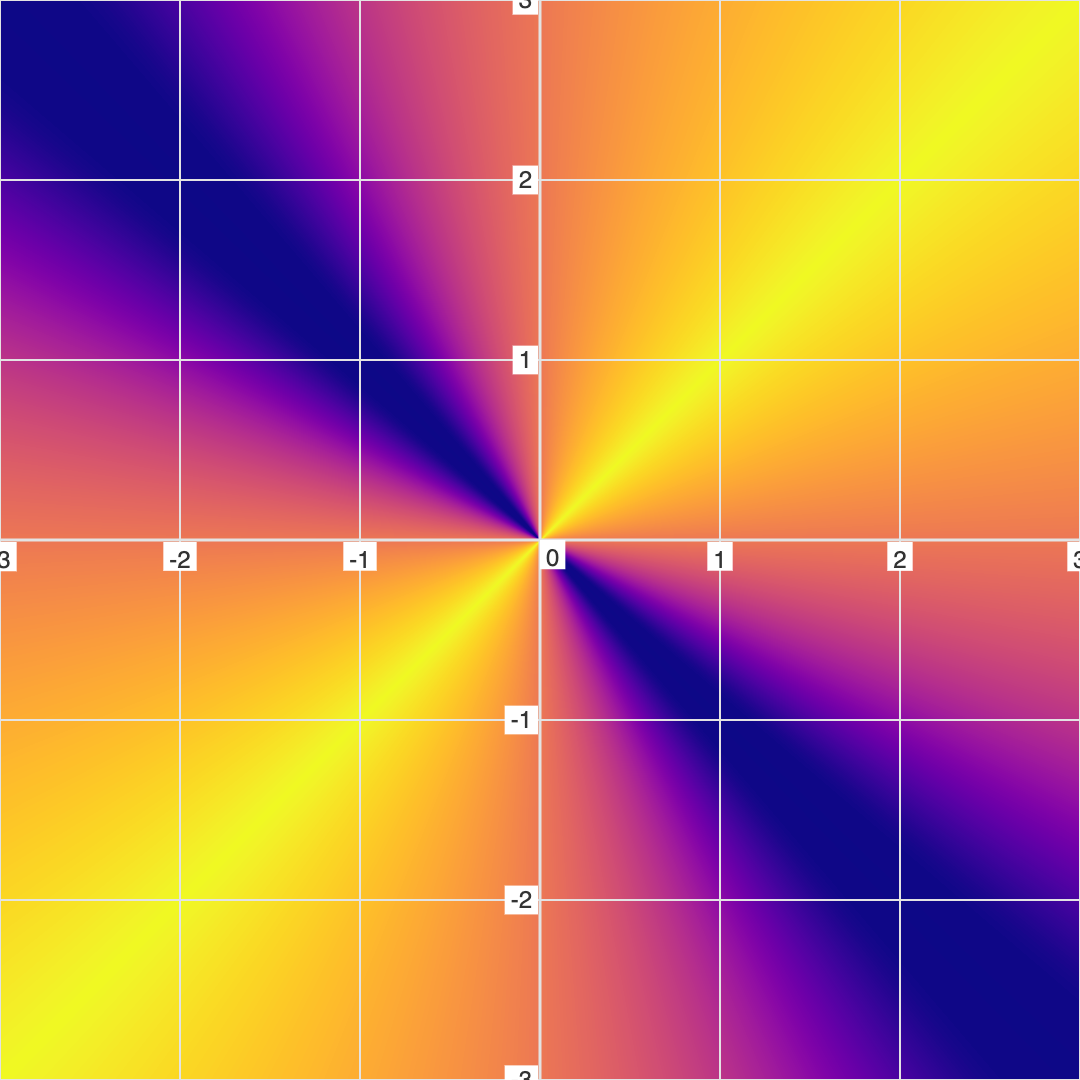 Fuzzy graph of \( (y-x) \times (y+x) = 0 \)
So as you can see, the line that was inverted (under the division line) is now a Shadow Line. And this seems like a more "correct" way to visualize this than as the conventional graph shows it (which is indistinguishable from the simpler equation, \(y-x=0\)).
Example 5: Phi Equation
This equation works almost exactly as the previous. And like before, let's start with multiplication to combine 2 equations (in this case, a circle and a vertical line equation): \( x \times (x^2+y^2-1) = 0 \).
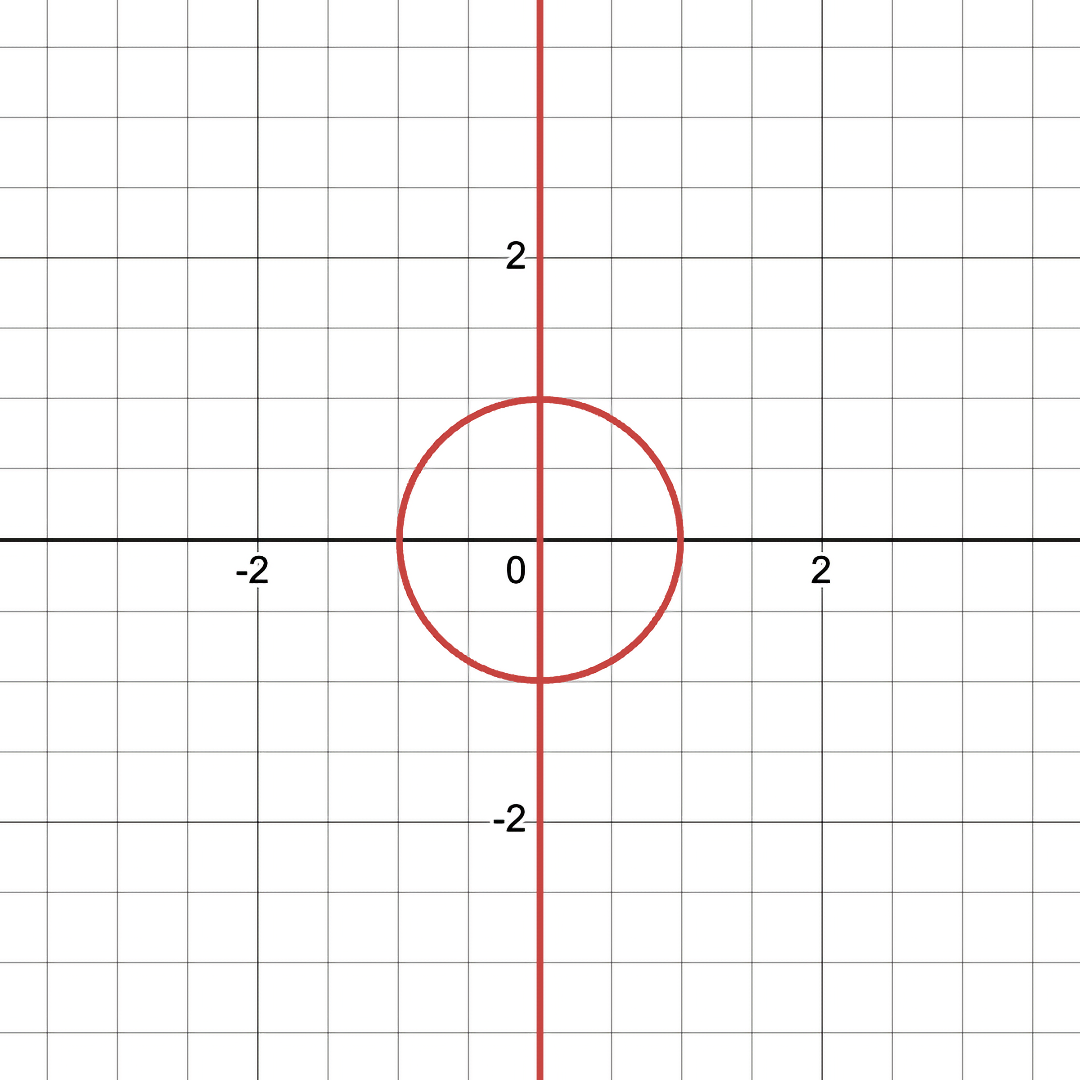 Graph of \( x \times (x^2+y^2-1) = 0 \)
 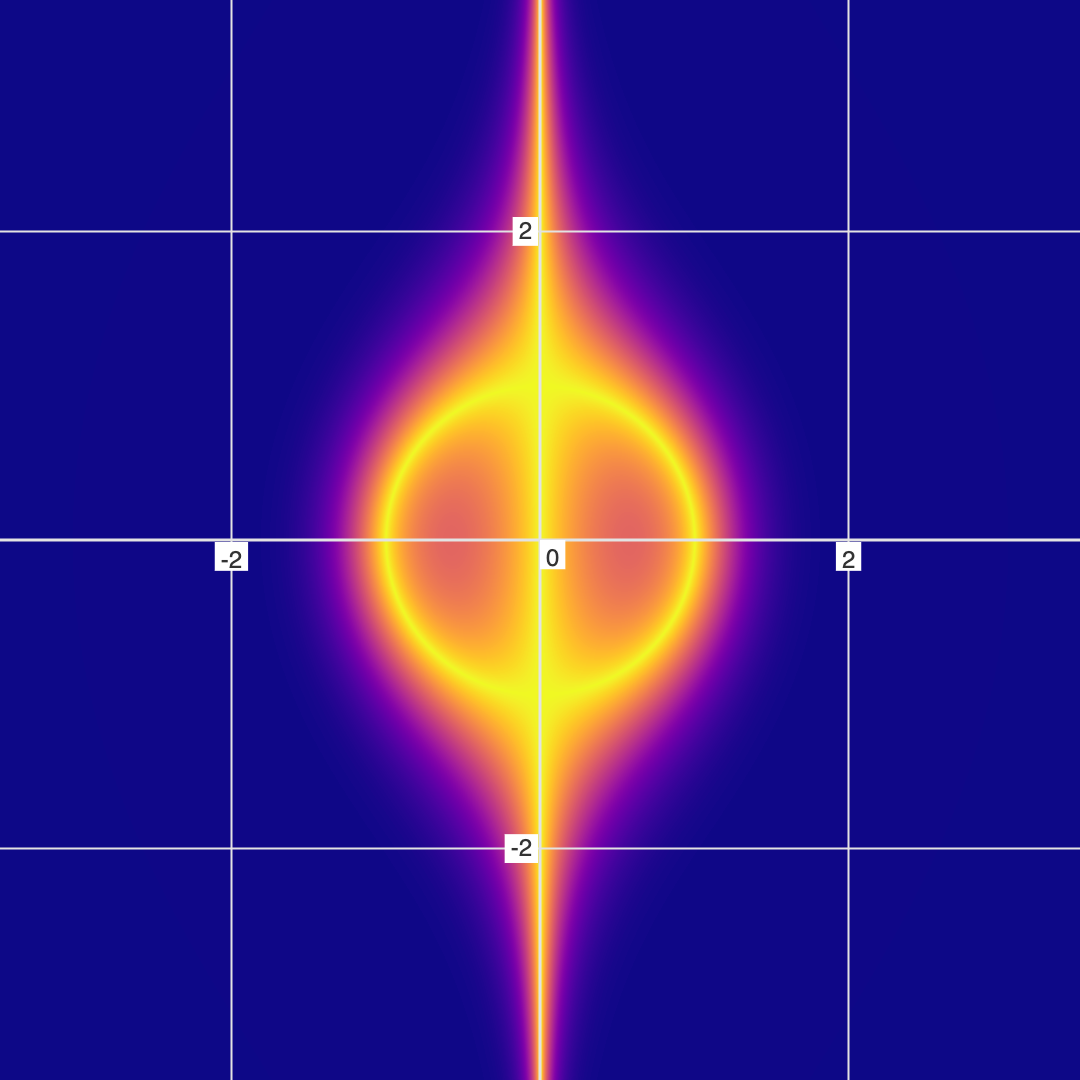 Fuzzy graph of \( x \times (x^2+y^2-1) = 0 \)
But now, let's invert the circle by using division, which makes the equation: \( \frac{x}{x^2+y^2-1} = 0 \).
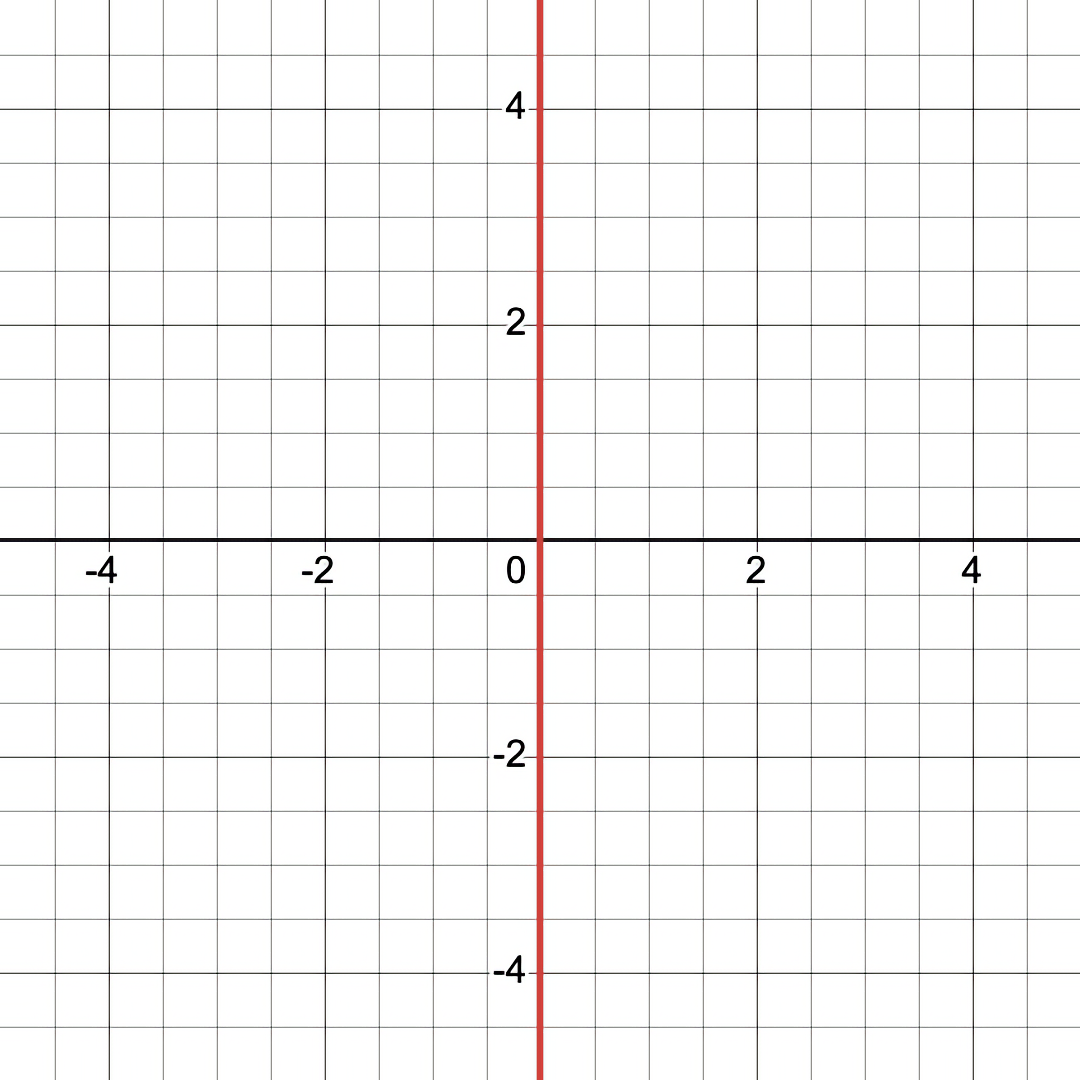 Graph of \( \frac{x}{x^2+y^2-1} = 0 \)
 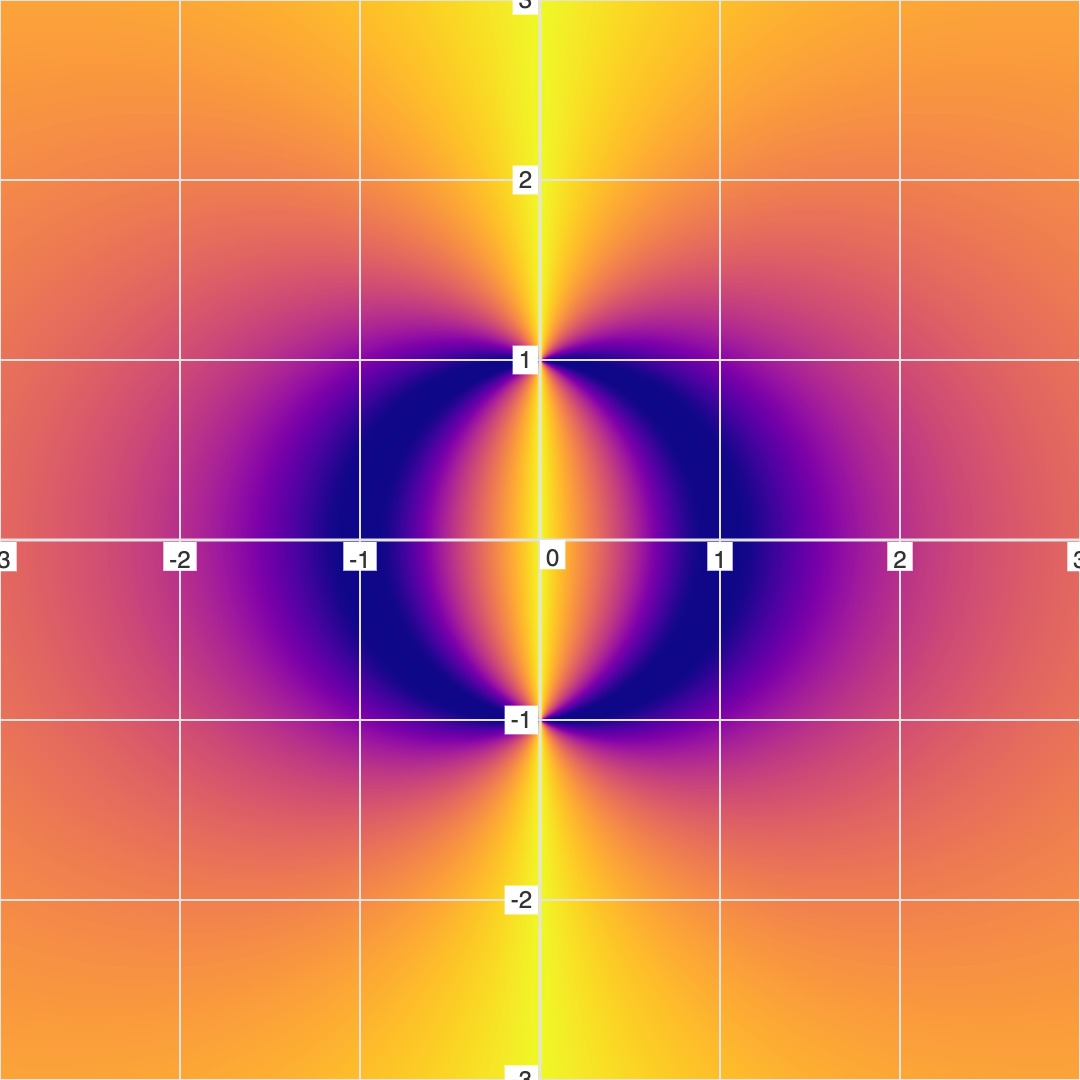 Fuzzy graph of \( \frac{x}{x^2+y^2-1} = 0 \)
Note that the Shadow Circle is invisible in the conventional graph. In fact, the conventional graph looks identical to a conventional graph of the \(x=0\) equation (as if the denominator was not there).
Example 6: Underwater Islands
In all of these previous examples, the "shadows" have represented areas of high error. But in this last example, we'll see some hidden details that represent areas of low error - areas that are nearly solutions to the equation.
Consider the equation, \( y=4 sin(x)+ sin(2.7y) \), as both a conventional graph and a fuzzy graph:
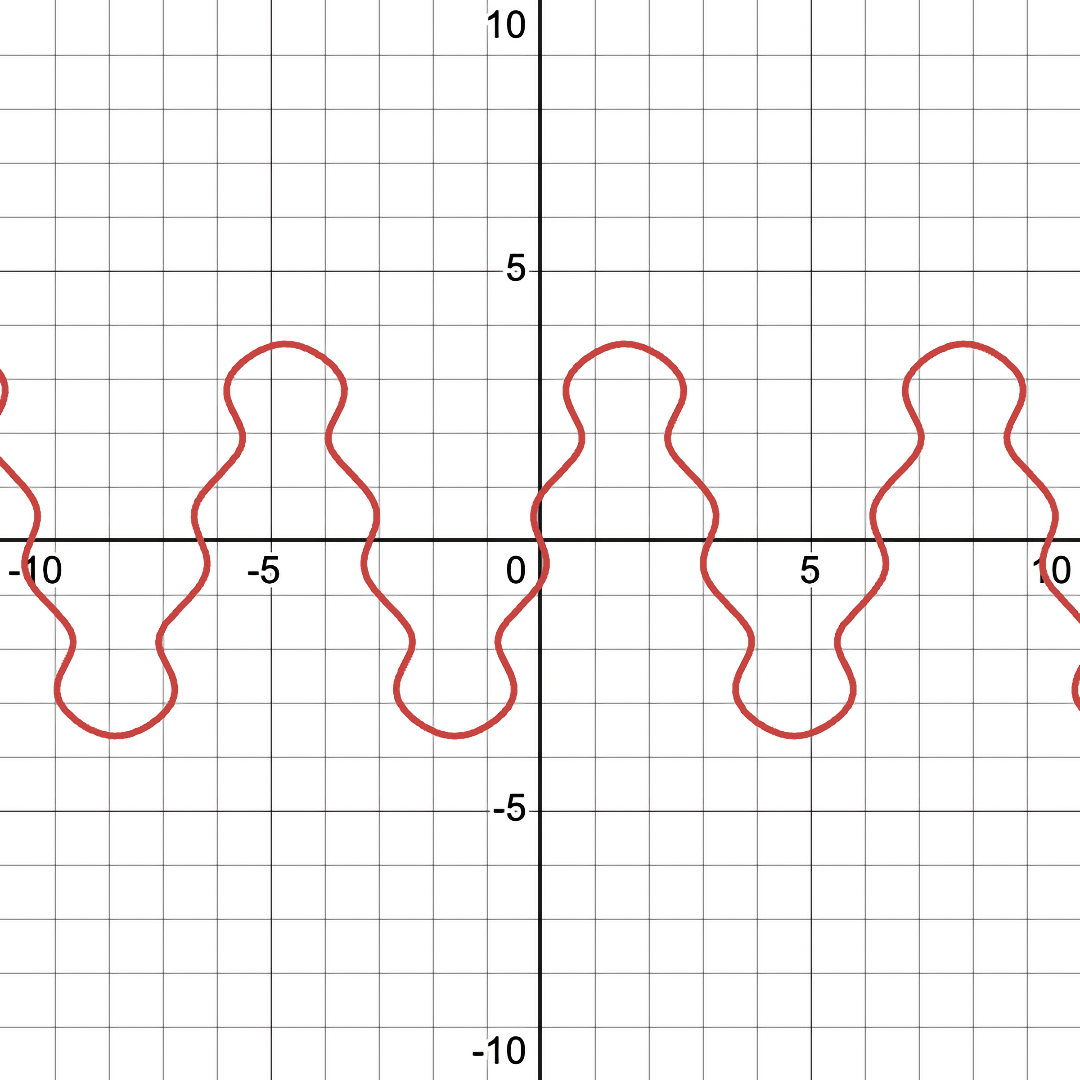 Conventional graph of \( y=4 sin(x)+ sin(2.7y) \)
 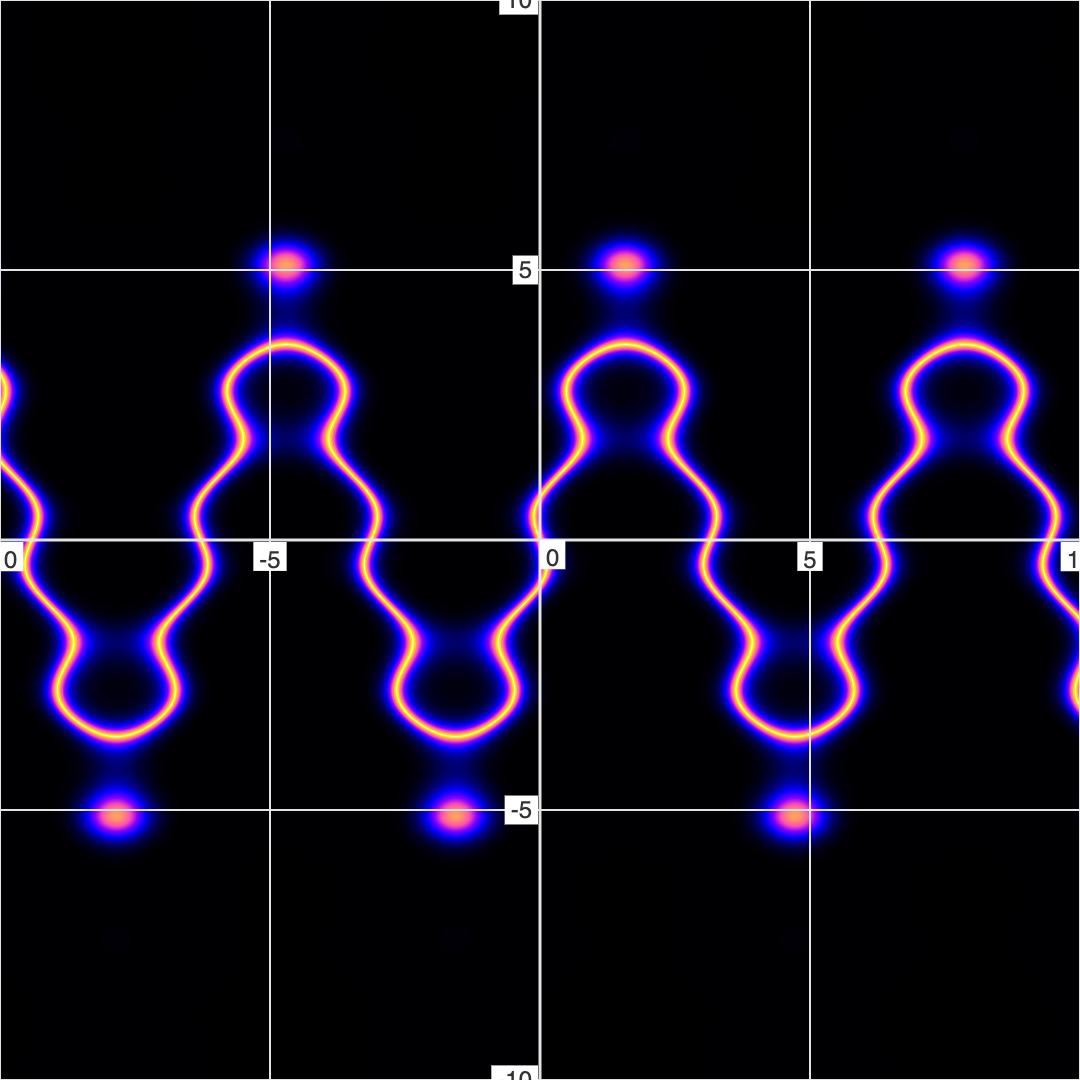 Fuzzy graph of \( y=4 sin(x)+ sin(2.7y) \)
Note the floating dots in the fuzzy graph version that are not there in the conventional/binary graph. These are like underwater islands - underwater mountains that are just below the surface of the water (or in this case, the \( error == 0 \) surface). These hidden islands represent area that are near-solutions to the equation (which are only visible in FuzzyGraph).
Their presense hints that we can tweak the equation slightly to cause them to burst above the surface of the water (which should also make them visible in conventional graphs).
So let's change the equation from:
\( y=4 sin(x)+ sin(2.7y) \) to:
\( y=4 sin(x)+ sin(2.8y) \)...
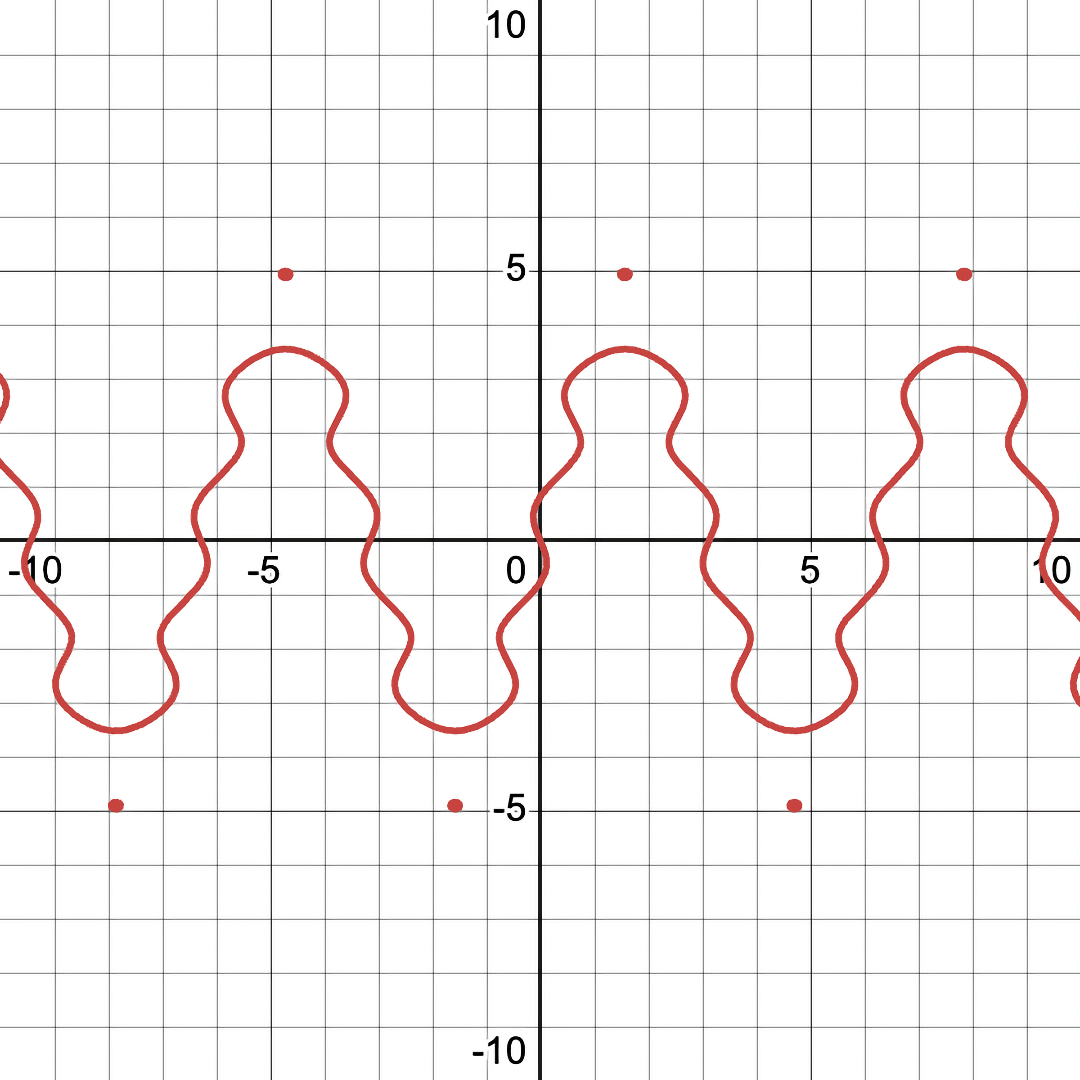 Conventional graph of \( y=4 sin(x)+ sin(2.8y) \)
 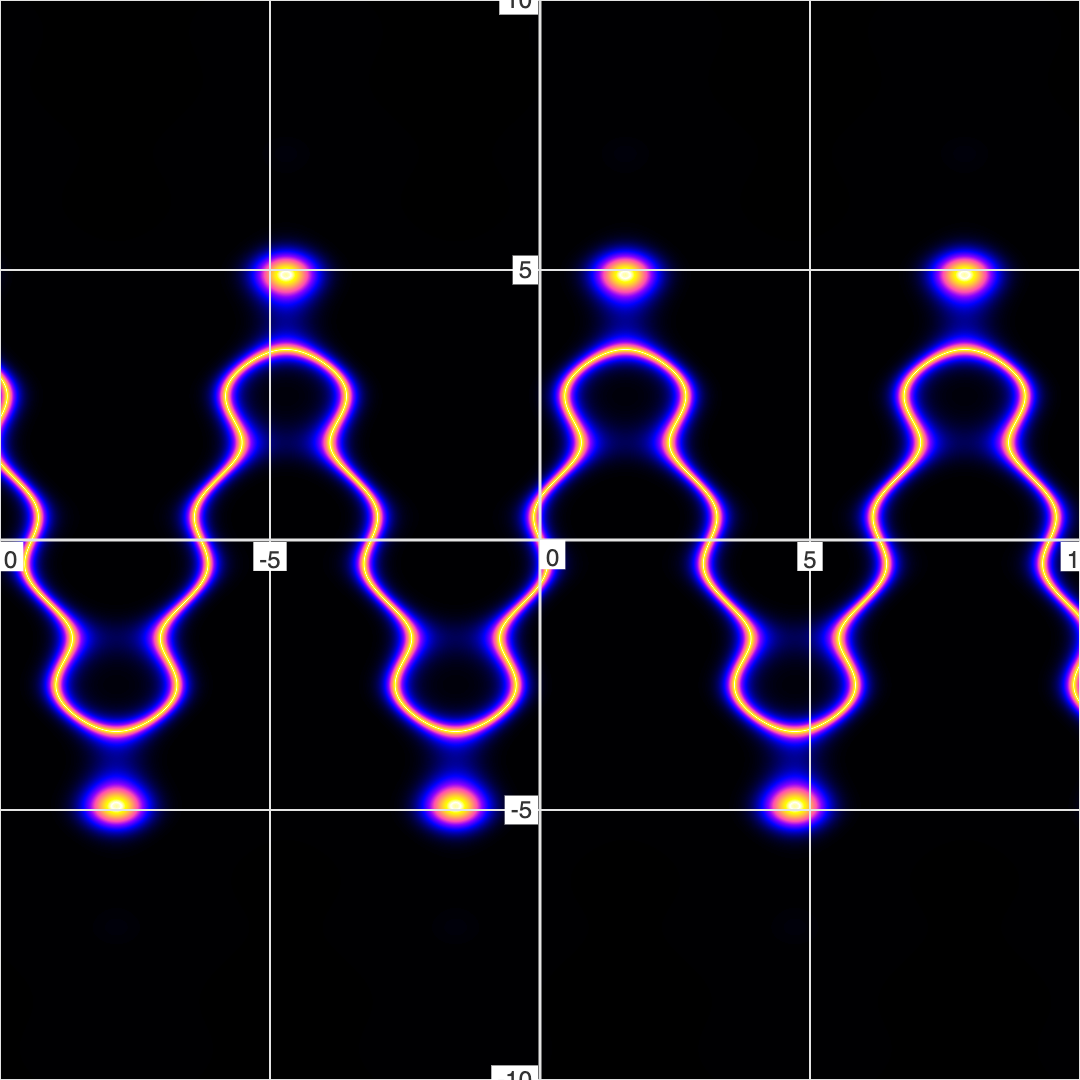 Fuzzy graph of \( y=4 sin(x)+ sin(2.8y) \)
And as you can see, those previously-hidden islands are now visible in the conventional graph.
So Fuzzy/non-binary graphing can help us see features of the mathematical topography that are completely invisible with conventional/binary.
Closing Remarks
In discussing this topic, some have remarked that a Fuzzy graph is not a graph of the original equation, but rather a heatmap of the "error divergence map". And to be fair, the equation typed into FuzzyGraph must be modified a little - to calculate the fuzzy graph, you have to take \( |left-right|^{fuzzyLevel} \).
But... I would argue that in order to visualize an equation in the conventional/binary form, the equation is being modified there as well. The logic to visualize an equation in the conventional/binary mode would look something like: "if Boolean(left == right): draw(black); else: draw(white)".
- * *
Date published: 2025-11-05
Date updated: 2025-11-06